

The market narrative around mortgage rates right now feels a lot like watching a chess match where both players have decided to take a coffee break. For weeks, we’ve been observing these fractional movements, a basis point up, two down, then maybe steady for a few days. It’s a holding pattern, sure, but what does that really tell us? My analysis suggests a lot more complexity beneath that calm surface than most headlines convey.
The Fed's Leverage and the Market's Ledger
Let’s cut to the chase: the Federal Reserve has made two quarter-percentage-point cuts to the federal funds rate this year, one in September and another in October. Common wisdom, or at least the hopeful chatter I’ve seen across financial forums, suggested this would translate into a more aggressive downward trend for mortgage rates. It hasn’t. We saw some noticeable downward movement in late August and early September, which was certainly a welcome relief for many (especially those on the sidelines, clutching their pre-approval letters like lottery tickets), but then it stalled.
As of November 24, Optimal Blue data showed the 30-year fixed conforming mortgage rate at 6.236%. Zillow, a day earlier, pegged it at 6.11%. That’s a tight band, a mere 12.6 basis points separating them, which for practical purposes, means we’re flatlining. My question here isn't about the accuracy of these numbers—they're well-sourced—but rather about the interpretation. Why haven't those Fed cuts acted like the financial equivalent of a sledgehammer, driving rates substantially lower? It's a critical discrepancy. The Fed doesn't directly set mortgage rates, of course, but their influence is undeniable. So, what other forces are at play that are effectively counteracting the Fed's easing? Are we underestimating the market's entrenched inflation fears, or perhaps the sheer burden of the national debt? The market has a memory, and it's a long one.
I’ve looked at hundreds of these data sets, and this particular inertia is unusual when the Fed is actively easing. It’s almost as if the market has decided to shrug its shoulders, saying, "Nice try, but we've got other concerns."
The Ghost of 2% and the Golden Handcuffs
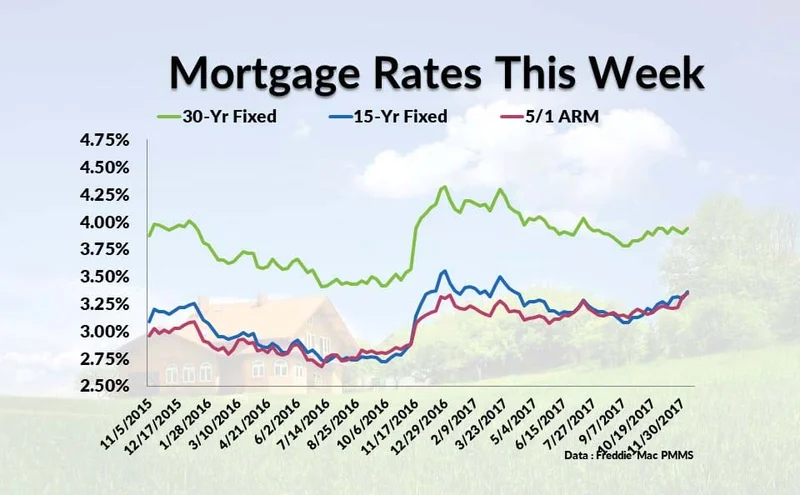
For anyone who entered the housing market between 2020 and early 2022, the current rates, even at 6.11%, feel like a punch to the gut. The historic average low for a 30-year fixed rate was 2.65% in January 2021. That was an anomaly, a product of unprecedented government stimulus during a global crisis. To be more exact, it was 2.65% according to Freddie Mac. We are talking about a unique historical blip, a financial unicorn that probably won't be seen again in our lifetimes unless the economic fabric of the world completely unravels.
Yet, this memory lingers. It's the reason why so many homeowners are still stuck in what we affectionately call "golden handcuffs." They’re sitting on 2.5% or 3% mortgages and simply can’t fathom selling their current home, losing that rate, and buying another at 6%+. It’s a completely rational financial decision, but it's also a chokehold on inventory. This phenomenon, while anecdotal in its individual instances, creates a quantifiable drag on market liquidity and keeps home prices stubbornly high, even as transaction volumes sag. It’s a feedback loop that the market seems unwilling, or unable, to break.
Here's where a methodological critique comes in: when we talk about "market activity," how much of it is genuinely new demand versus people forced to move due to life events? The data on "new buyers" vs. "relocating homeowners" often gets blended, obscuring the true picture of organic market growth. Without more granular data, it’s hard to tell if the current slight uptick in activity is sustainable or just a churn of necessity.
What's Next on the Rate Rollercoaster?
The immediate future points to another Federal Reserve meeting in early December, with the potential for yet another rate cut. Will this finally provide the sustained downward pressure that many have been hoping for? Or will it be another gentle nudge in a market that's more concerned with broader macroeconomic headwinds? Some observers are already voicing concerns that presidential policies (read: Trump's tariffs and potential deportations) could lead to a tighter labor market and, you guessed it, a resurgence of inflation. It’s a complex web of interconnected variables, and anyone promising a clear, linear path is selling you a bridge to nowhere.
The bottom line is, experts aren't anticipating a drastic drop anytime soon. The era of ultra-cheap money is over. We're back to a historical norm—rates around 7% were common from the 70s through the 90s, remember? (Even 18% in '81, if you want a real scare). The current "steady" state around 6% is less a sign of impending decline and more an indication that the market has found a temporary equilibrium, a precarious perch between the Fed's easing and persistent underlying anxieties. For homebuyers, this means understanding the landscape: excellent credit (740+ is top tier), a low DTI (ideally below 36%), and, critically, comparing offers from multiple lenders. Freddie Mac’s research suggests you could save $600 to $1,200 annually by simply shopping around. That's not insignificant in a market where every basis point counts.
The New Normal's Uncomfortable Silence
The current mortgage rate environment isn't a pause before a dramatic plunge; it's the market's quiet acknowledgment that the days of financial fantasy are over. We're in a holding pattern, yes, but it’s a holding pattern at a significantly higher altitude than most people want to admit, and the descent isn't guaranteed.